Found this publication, a bit old from 2005 but has some interesting tables about UK wind resource capacity factors.
https://www.eci.ox.ac.uk/publications/d ... source.pdf
One of the tables from that publication.
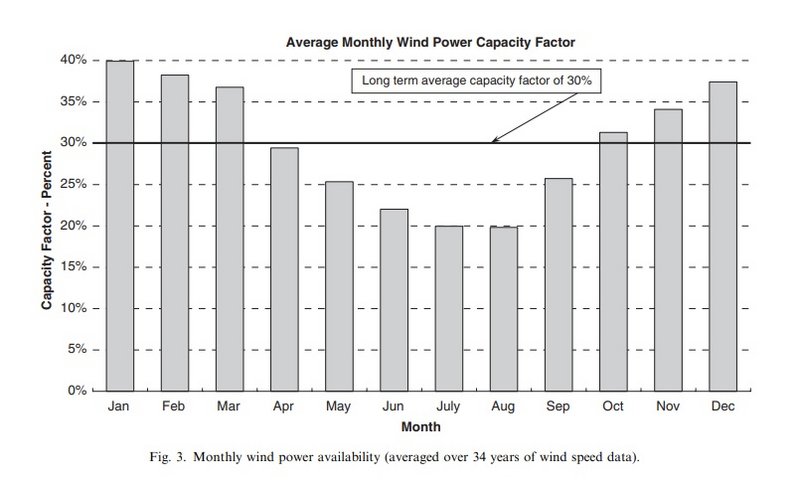
The original forecast for WT1 P75 was based on an average capacity factor of 30.5%, so should be similar to the above graph. Most years vary + / - 10% but last year (2021) the onshore UK wind resource has been deemed by UK Greencoat Wind as down 20% on baseline, worse year since 2010. Don't know how this years is performing yet in terms of available wind resource.
I have just worked out the capacity factors (CF) for WT1 since the start as now the June figures are in,
March 36.7% (based on 16 days pro rata)
April 25.8%
May 22.4%
June 15.0 %
Therefore the average CF for WT1 for the 4 months is about 25% which compares with circa 28% on that graph above so we are not far off 10% of the target figure so far, so all looks good, especially with the initial teething problems and the first service.

EDIT - June CF is actually 23.3% as Ripple have initially released incorrect data so average overall is now 27%.